Expected Goals (xG) has changed the way players and coaches think about shooting. It’s a metric that tells us how likely a shot is to result in a goal, essentially a quality rating for chances. For example, a 30-yard long shot might be worth only 0.05 xG (a 5% chance of scoring), whereas a close-range tap-in could be 0.7 xG (70% chance) . The higher the xG value, the better the opportunity . Instead of focusing only on goals, xG shines a light on chance quality, helping players understand how good their opportunities are. Coaches at top clubs use xG data to teach smart shot selection, favoring high-percentage chances and avoiding low-percentage ones . In fact, if you’re consistently firing low-quality shots (like hopeful strikes from 25 yards with ~5% chance), you’re doing the opposing team a favor .
This article is a guide for youth players (ages 12–18) to create an Individual Expected Goals (ixG) model, essentially your personal xG tracker. Why do this? Because tracking what kinds of shots you take and their quality can seriously boost your development. You’ll learn to take smarter shots, improve your finishing, and make better decisions on the field. Plus, we’re going to get your parents involved in a positive way. Parents can help record your shot data during games and practices. Not only will this support your growth, but it also gives parents something constructive to focus on from the sidelines (a welcome distraction from just shouting or stressing!). Let’s dive into how you can start tracking your own ixG, step by step.
What is Expected Goals (xG) and Why Does it Matter?
In simple terms, Expected Goals (xG) is a statistic that rates the quality of a shooting chance on a scale from 0 to 1. An xG of 0.0 means no chance of scoring; 1.0 means a certain goal. Most chances fall somewhere in between. As mentioned, a tough shot from distance might be ~0.05 xG, while a point-blank shot could be 0.5 xG or higher . The number represents the probability of that shot resulting in a goal. The beauty of xG is that it captures information we might overlook if we only count goals. For instance, if you took five shots in a game and none went in, you might feel you had a “bad game.” But what if those five shots were all from outside the box under heavy pressure? The xG total of those shots might be very low (say 0.2 combined), indicating you actually didn’t have any great chances to begin with. Conversely, you might score a goal in another game, but if it was from a very tight angle (a low xG chance), you shouldn’t rely on that kind of shot every time.
Why does xG matter? It helps players and teams make smarter decisions. Top scorers in the modern game maximize high-xG chances and avoid wasting shots from poor positions . Studies of professional leagues show that the majority of goals come from inside the penalty area – usually 80-85% each season . There’s a reason for that: shots in the box are simply more likely to go in. Coaches use xG maps to show players where they should be shooting from more often . If a youth striker keeps ripping shots from 20-30 yards out (maybe a 5% chance each), the coach might point out that moving closer or finding a cut-back pass for a one-time finish (20-40% chance) would lead to more goals . In other words, xG can quantify what a “good shot” is. A high xG (like 0.4) means an excellent chance, whereas a low xG (0.05) means a speculative try . Understanding this helps players develop shot IQ, knowing when to shoot and when to work for a better opportunity.
For you as a young player, think of xG as feedback on your shot selection. After a game, you could tally up the xG values of all your shots to get a sense of whether you created good chances. You might be surprised. You may realize that even though you scored one goal, most of your shots were low-percentage attempts. Or maybe you didn’t score, but you generated a couple of high-quality chances (which means keep going, the goals will come next time). This is where ixG comes in, it’s your personal expected goals number, based on the shots you take. By tracking ixG over time, you’ll gain insight into your playing style and decision-making. Even youth academies now talk about shot maps and xG, so you’ll be ahead of the game by building those habits early.
Introducing ixG, Tracking Your Own Chances (With a Little Help from Parents)
ixG (Individual Expected Goals) is simply applying the xG concept to your performances. Instead of a professional analyst doing it, you (and your parent) will keep track of each shot you take: where it was from and what the outcome was. Each shot will get an ixG value to represent how good of a chance it was. When you add them up, you’ll have a number that tells you roughly how many goals you expected to score given the looks you had. Compare that to how many goals you actually scored, and you get extremely useful information:
- If your actual goals are lower than your ixG over a period, it means you’re getting chances but not converting as often, an indicator to work on your finishing or composure. Don’t be discouraged by this; even top players sometimes go through spells of underperforming their xG. The positive is that you’re getting into the right spots. Finishing is a skill you can improve with practice, so keep at it.
- If your actual goals are higher than your ixG, you’re finishing above expectation, which is great (it might indicate strong finishing skills). But it could also mean you scored some low-percentage chances that might not always go in. It’s a sign you’re doing well, but you should still strive to create easier chances to sustain that success.
- If your goals and ixG are about the same, you’re finishing at an expected rate. Consistency is key, and you can aim to raise your ixG (meaning get even better chances) over time as you improve your movement and decision-making.
Most importantly, tracking ixG shifts your focus from just “Did I score?” to “How good were my chances?”. This is huge for development. It teaches you that not all shots (or goals) are equal. Scoring a goal by dribbling three defenders and hitting a 25-yard screamer is awesome, but doing that regularly is unlikely. Meanwhile, making a smart run to the near post and scoring a simple one-touch finish might not look as flashy, but it’s repeatable and reliable. By analyzing your ixG, you’ll start to notice patterns in your play: maybe you realize most of your goals come from one-touch finishes inside the 6-yard box, or that you haven’t scored any with your weaker foot, or that you’re taking a lot of shots from outside the box that rarely go in. These insights are gold for your training, they show you where to focus.
Getting Parents Involved
To effectively track ixG, you’ll need data from your games (and even practices). This is where parents can become your secret weapon. During games, it’s hard for you as the player to note down every shot, you’re busy playing! Having a parent or family member record your shots frees you to concentrate on the game while ensuring the information isn’t lost.
Ask one of your parents if they’d be willing to be your “stat helper.” All they need is a simple shot chart (we’ve provided a template below) and a pen. This not only helps you, but it also gives parents a positive role on the sideline. Instead of just feeling nervous or yelling instructions, they’ll be focused on tracking shots and outcomes. In our experience, this improves sideline behavior and turns the parent into more of a partner in development. They become an objective observer jotting down data, which can reduce the urge to shout criticisms or get overly emotional about the game. It’s a win-win: you get valuable feedback later, and they channel their energy into something productive that supports you.
Parents can also help in post-game analysis. After the match, you two can sit down together and review the shot map. This can be a great parent-child activity that reinforces learning. It opens up supportive conversations like, “I saw you had two shots from very wide angles, what could you do next time to get a bit more central?” or “When you got into that prime area, you really tested the keeper. How can we get you into that spot more often?” When parents are involved in this way, it shifts the dynamic from the parent as a critic on the sidelines to a coach/partner off the field. The tone becomes constructive and encouraging, which is exactly what young players need. Many parents find they enjoy having this concrete task; it keeps them engaged in the right way.
Now, let’s talk about the concrete steps to start tracking your ixG.
How to Track ixG: Step-by-Step Guide
Tracking your ixG is easier than it sounds. You don’t need any fancy software, just a printable field template, a pen, and a willingness to track your shots consistently. Here’s how to get started:
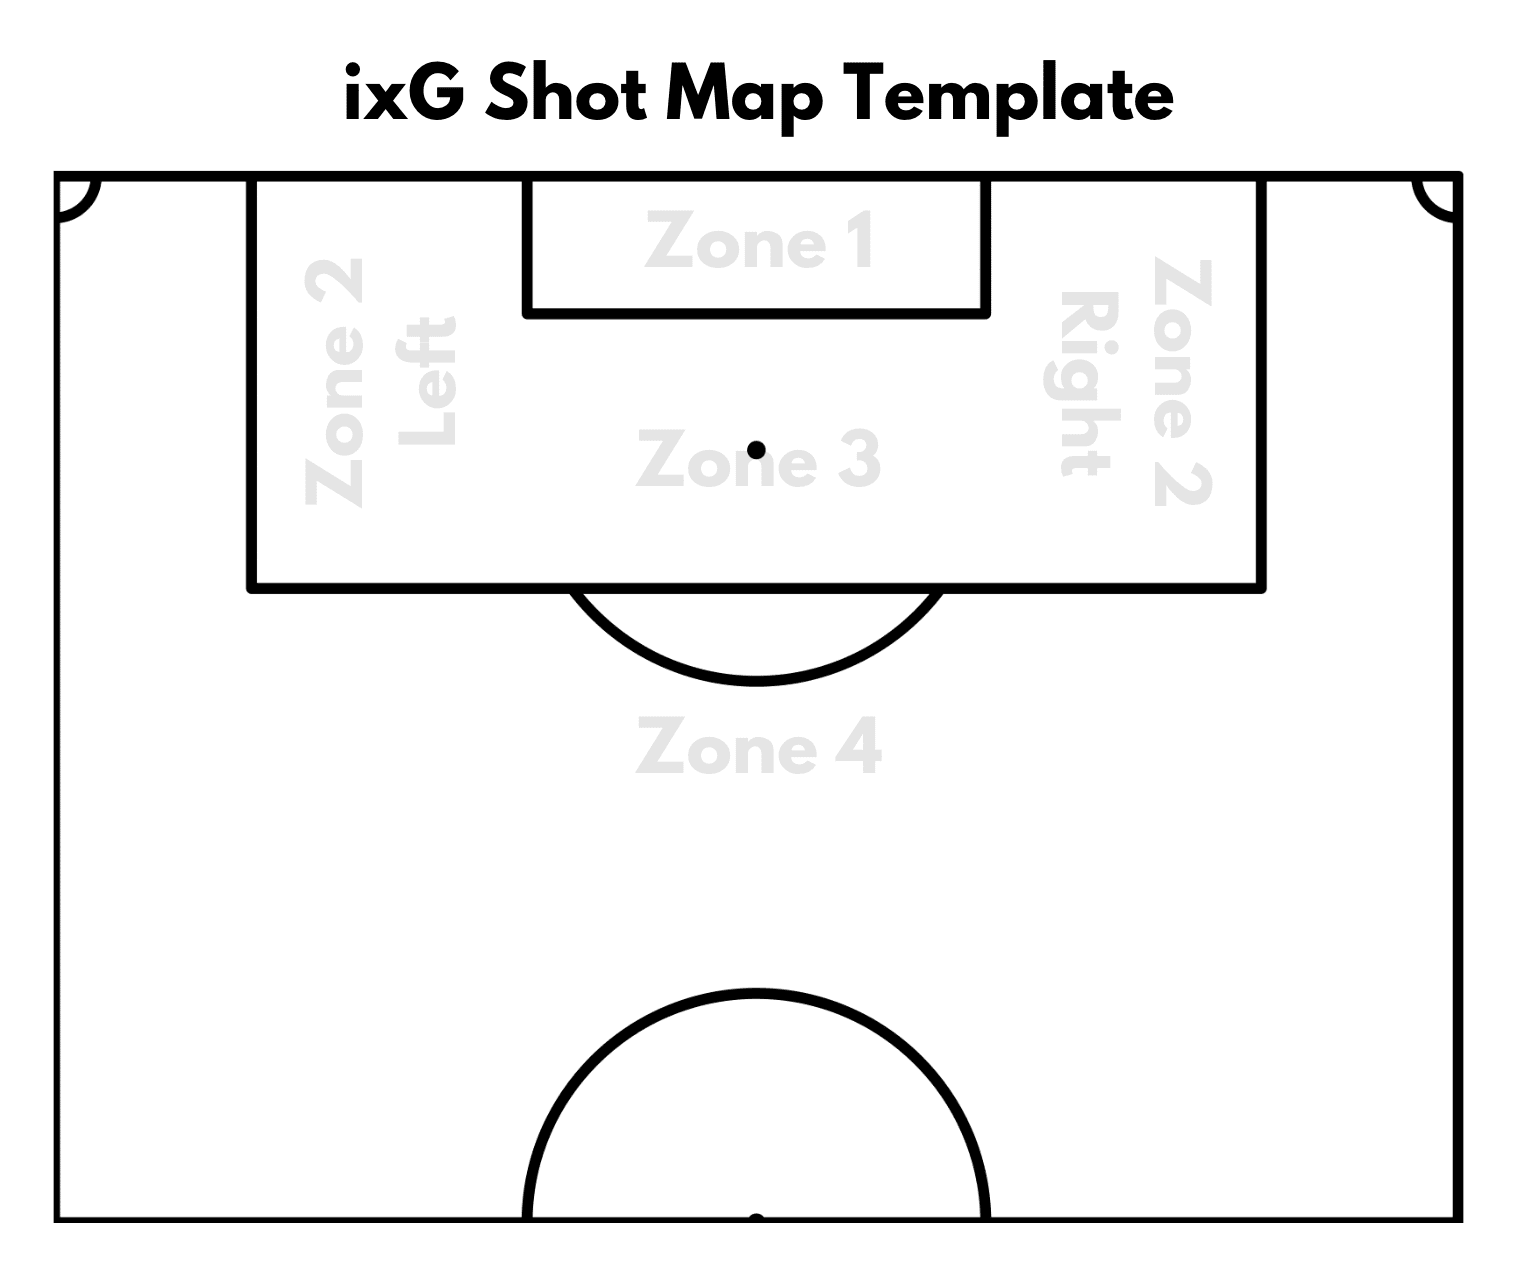
1. Print a Shot Map Template: Use a half-field soccer template that includes the goal and penalty area. (We’ve provided a sample template below that highlights key shooting zones). Bring a few copies to each game. Each page will be used to mark all your shots for that match (or practice).
A simple shot map template divided into zones. Youth players and parents can print this out and mark shot locations during games. Zone 1 (central close range), Zone 2 (wide areas in the box), Zone 3 (central penalty area around the “goal zone”), and Zone 4 (outside the box) are labeled to help categorize shot quality.
How to use the template: When the game starts, have your parent keep the blank shot map handy. Every time you take a shot, they will put a mark on the map in the approximate location from where you shot. We recommend using a specific notation for clarity:
- Draw a star (★) for a shot that results in a goal (you scored).
- Use a blue dot (●) for a shot on target that was saved by the keeper (or blocked by a defender on the way). (Blue = on frame, as in the example chart we’ll see later.)
- Use a red dot (●) or an “X” for a shot that missed the target (went wide or over the bar). (Red = off frame).
You can also write a small number next to the mark to indicate the shot number or the minute of the game, if you want to get detailed. But at minimum, location and basic outcome (goal/on-target/off) are enough. By the end of the game, you’ll have a rough shot map of all your attempts.
2. Track Shots in Both Games and Practices: Consistency is key. Try to have a parent (or coach or teammate) record your shots every game. You should also track shots in practice scrimmages or finishing drills, especially if you want more data to work with. The more shots you log, the more reliable your ixG analysis will be. Aim to collect data for at least 5 games and a few practice sessions before drawing big conclusions. Why five? In a single match, you might only take a few shots, which isn’t a lot of data. Over five games, however, you might accumulate, say, 15–20 shots or more, which starts to reveal patterns. Similarly, logging some shots from practice (for example, shots from small-sided games or shooting exercises) can supplement your data. After about 5 games (and maybe 3 solid practice sessions with shooting), you’ll have a decent sample to identify trends, for example, you might notice “Hey, out of 30 shots, I’ve only had 5 from inside the 6-yard box” or “I’m taking a lot of shots from Zone 4 (outside the box) that aren’t yielding goals.” Without a minimum sample size, you might misinterpret randomness (one lucky goal or one bad miss). So, collect enough data to see the bigger picture.
3. Assign an ixG Value to Each Shot: Now comes the fun part, giving each shot a score that represents its chance of resulting in a goal. We will use a simple ixG formula based on shot location (and we’ll account for outcome separately). Don’t worry, you won’t need calculus or a computer; just use the guidelines below to estimate each shot’s xG. Think about where the shot was taken from on the field (which zone) and use that to assign a value:
• Zone 1 (Central, very close range), These are shots from right in front of goal, roughly the 6-yard box area or penalty spot with a clear sight. These are high-probability chances. Assign about 0.5 ixG (50%) for shots in this zone. If it was a really point-blank tap-in or header right on the doorstep, you could even go up to 0.6. Essentially, Zone 1 is your “golden chance” zone.
• Zone 3 (Central in the rest of the penalty area), This covers the bulk of the penalty area in front of goal (roughly the middle section of the box around the penalty spot, outside the 6-yard). Shots here are usually good chances but not as guaranteed as Zone 1. Assign around 0.3 ixG (30%) for shots from Zone 3. For example, a shot from near the penalty spot with a bit of traffic or a one-timer from 12 yards out is often in this range (20-40% chance). Many bread-and-butter scoring chances fall in this category .
• Zone 2 (Wide areas inside the box), These are shots taken from inside the penalty area but at a tighter angle (to the left or right side of the goal). Because the angle is less favorable, the chances are lower. Assign roughly 0.15–0.2 ixG (15-20%) for shots from wide inside the box. For instance, a shot from near the corner of the 18-yard box or a tough angle near the endline might be around 0.1 or less, whereas something a bit more central but still angled might be closer to 0.2.
• Zone 4 (Outside the box), These are long shots taken from outside the penalty area (20+ yards out). Generally, these have a low probability of going in. Assign about 0.05–0.1 ixG (5-10%) for shots from outside. You can shade it higher if it was just outside the box and fairly central (maybe ~0.1), or lower if it was from very far or a difficult position (~0.03-0.05). Most long-range attempts are low percentage, which is why you want to be selective with them.
These values aren’t hard science, they are estimates to help you gauge your chance quality. The key is to be consistent in how you assign them. Over time, as you get a feel for it, you can adjust slightly, but don’t worry about tiny differences. The goal is to separate great chances from OK chances from poor chances in a way that makes sense for you.
Incorporating the Outcome: Notice that in the ixG values above, we haven’t directly used whether the shot was on target or a goal. That’s on purpose, xG is about the chance quality before we know the result. Even a shot that missed the goal entirely had some chance of going in (if it had been struck better). However, we do want to track outcome for learning purposes. Here’s how to handle it:
- First, assign the ixG based on location regardless of outcome. A shot from Zone 1 gets 0.5 whether it went in, was saved, or missed, because inherently it was a great opportunity.
- Next, record the outcome alongside it. You already did this on your chart (star for goal, blue dot for on target, red for off). Now in your notes you might have something like: “Shot 3 – Zone 3 – 0.3 ixG – on target (saved)” or “Shot 5 – Zone 4 – 0.05 ixG – missed target”.
- If a shot resulted in a goal, you’ll count that later in your actual goals tally. But resist the urge to bump up the xG just because it went in. A low-percentage shot that you scored is great execution (kudos!), but it was still a low-percentage shot. Likewise, if you flub a wide-open chance, don’t give it a lower xG; note that it was a high-xG chance that went untaken, that’s a cue to practice and convert next time.
Optional: Some players like to incorporate a slight modifier for on-target vs off-target in their personal model, to reflect execution. For example, you might say an on-target shot keeps full value, but if you completely miss the frame, you count only 75% of the xG value (since a shot that doesn’t force a save can feel like a wasted chance). This is optional and up to you, the danger is you could end up double-counting the outcome. The purest approach is to assign the base ixG and use outcome as a separate reference (not in the formula). But if a small tweak motivates you to hit the target more, you can do it. For instance: 0.3 becomes 0.25 if off-target. The main point is to be honest about the chance’s quality. Don’t inflate a bad shot’s xG or deflate a good chance’s xG based on what happened after the shot.
4. Calculate Your Total ixG and Compare with Goals: After each game (or a set of games), add up the ixG values of all your shots. This gives you a total “expected goals” for that period. For example, you might find that over 3 games you took 8 shots totaling about 1.8 ixG, and you scored 2 goals in that time. Or perhaps you had 0.8 ixG and scored 1 goal, etc. There’s no “perfect” number you’re looking for, it’s information. Now compare: how many goals did you actually score vs. your total ixG? This is where you see if you’re finishing above, at, or below expectation. If you scored 4 goals from 2.0 ixG, that’s excellent finishing (you doubled expectation!). If you scored 1 goal from 2.0 ixG, that tells you that you’re getting chances but need to convert more of them. Keep a log week by week. For instance:
- Week 1: ixG = 0.5, Goals = 0.
- Week 2: ixG = 0.8, Goals = 1. Week 3: ixG = 0.6, Goals = 0.
- Week 4: ixG = 1.2, Goals = 2.
- Cumulative Month 1: ixG = 3.1, Goals = 3.
In this hypothetical, over the month you had roughly 3.1 expected goals and scored 3 goals, pretty much on par. The week-to-week might fluctuate, but over a few games you get a clearer picture. We’ll discuss how to interpret and use this data in the next section.
Before we move on, let’s look at a real-life example of how shot selection and xG make a difference at the highest level.
Case Study: Rachel Daly’s Shot Map Mastery (2022/23 WSL Season)
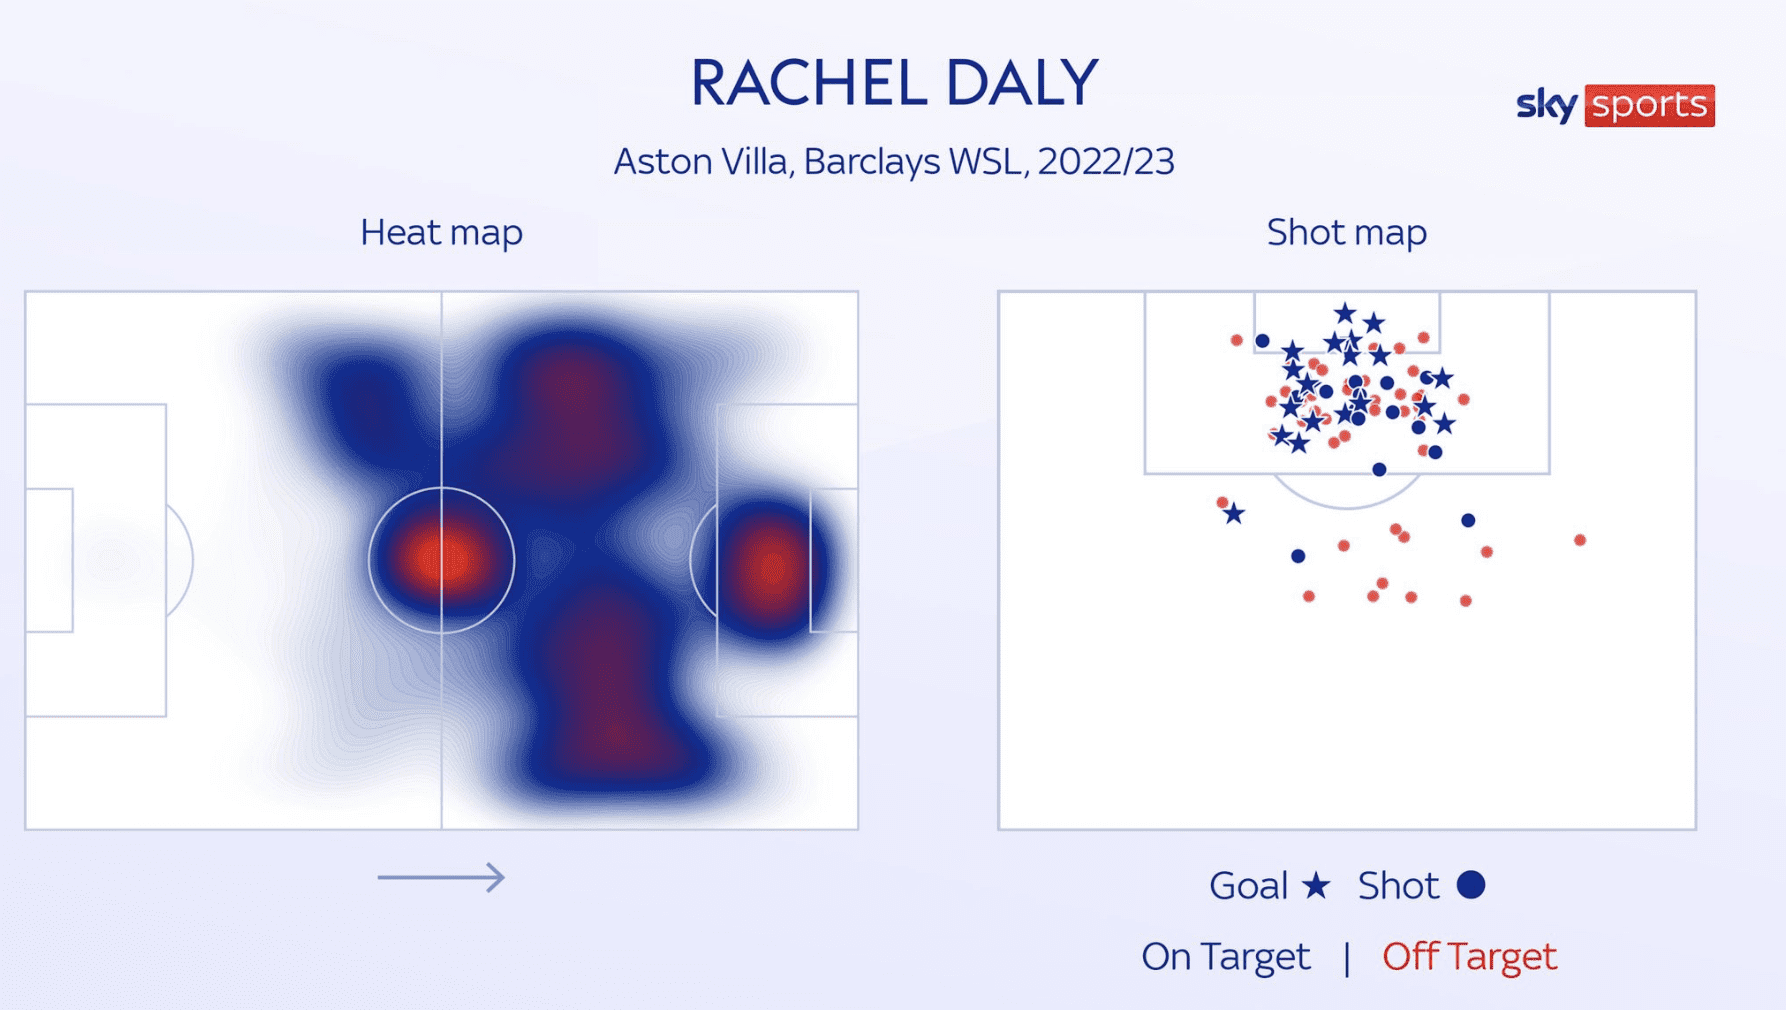
To see why focusing on good chances is so important, look no further than Rachel Daly’s incredible 2022/23 season in the Women’s Super League. Rachel Daly (Aston Villa forward, and now England international) dominated the league with 22 goals in 22 games, tying the single-season scoring record . She didn’t achieve this by taking wild shots from everywhere, in fact, her shot map is a coach’s dream of smart shot selection .
Rachel Daly’s heat map (left) and shot map (right) for Aston Villa in the 2022/23 WSL. The shot map shows Daly’s shots: blue stars are goals (on target), blue dots are on-target shots that didn’t score, and red dots are off-target shots. Nearly all of her goals (stars) are inside the penalty box, clustered in front of goal, illustrating how she concentrates her efforts in high-value areas.
Look at Daly’s shot distribution. The vast majority of her shots came from inside the penalty area, especially the central zone in front of goal. According to the data, 102 of her 128 shots that season were taken inside the box, and only 22 were from outside . The outcomes speak volumes: she scored 32 goals from those 102 inside-the-box shots, but only 1 goal out of 22 outside-the-box shots . In percentage terms, she scored on about 31% of her shots in the box (nearly one in every 3) but only ~4.5% of shots outside (about one in 22) . That 4.5% is actually right around that 0.05 xG we’d expect for long attempts. Daly intuitively understood that to score a lot, she needed to get into the high-xG zones as much as possible.
It paid off: by living in the “goal zone” and central areas, she racked up 22 goals (not counting a few penalties). Her expected goals (xG) for the season was about 15, and she exceeded that by scoring 19 non-penalty goals . Scoring more than your xG, especially over a full season, is a sign of lethal finishing. But importantly, Daly’s high xG total itself was a product of her movement and choices. She consistently made runs to spots where the chances are greatest. She scored many of her goals from one-touch finishes near the 6-yard box, tap-ins around the penalty spot, and close-range headers . Eight of her goals came from open-play crosses and another 11 from set-piece deliveries (corners, free kicks), those scenarios often lead to close-range shots (headers or volleys) with high xG values, and she was there to put them away.
What can a young player learn from Rachel Daly’s shot profile? Be in the right place, and the goals will come. Daly isn’t necessarily towering over defenders or vastly quicker; she’s beating them with intelligent positioning and anticipation . She makes run after run in the box, darting to the near post, peeling off to the far post, hovering around for rebounds, so that when a teammate delivers a cross or a loose ball drops, she’s in a high-percentage spot to score . Nearly every goal she scored was from 6 to 12 yards out, essentially within Zone 1 or Zone 3 in our earlier terms. She rarely bothered shooting from 25 yards, because why take a 5% shot when you can work for a 30% shot? As Daly’s season shows, if you consistently take better shots, you greatly increase your chances of scoring (and she had the golden boot to prove it). It’s high-percentage football at its finest .
So, when you look at your own shot map and ixG data, keep Rachel Daly in mind. Are your shots clustered in the dangerous areas like hers, or are they scattered from tough positions? Of course, youth games are different and you might not get as many perfect chances, sometimes you have to try that long shot. But the principle holds: the more you can tilt your game toward high-xG chances, the more success you’ll have. And now that you’re tracking ixG, you’ll actually have the data to back that up or identify what you need to change.
Reviewing Your ixG Data: Learn and Improve
Tracking ixG is only half the battle, now you need to use that information to get better. This is where you, your parents, and even your coach can sit down and draw insights from the data. Make it a routine: maybe every week after your matches, spend 20 minutes to review your shot chart and stats. Here’s how to get the most out of your ixG tracking:
Identify Patterns and Habits: Lay out your shot maps from recent games side by side. Do you notice that most of your shots are coming from a particular zone? Maybe you see lots of marks in Zone 4 (outside the box) and not many in Zone 1 or the “goal zone.” That might indicate you tend to settle for longer shots, a sign to work on moving closer or finding better openings. Or you might notice many of your on-target shots are from the left side of the box (perhaps you favor your right foot, so you cut in from the left). Recognizing these patterns is the first step to adjusting your play. For example, if you see few shots from Zone 3 (penalty spot area), you might make it a goal to crash that area more on crosses or cut-backs. If you have many off-target shots from a certain area, you can practice that specific shot in training.
Compare ixG to Actual Goals Consistently: Look at your totals over a series of games (not just one game, which can be an outlier). Is there a gap between your ixG and your goals? If you had, say, 5.0 ixG over a month but only 2 goals, that’s something to dig into. Are you perhaps snatching at chances and shooting right at the keeper? Or maybe you’re unlucky and hitting the post, it happens. The solution could be technical (finishing practice), mental (composure in front of goal), or tactical (better shot selection even within those good areas). On the flip side, if you scored 5 goals from 2.0 ixG, great job, but be mindful that finishing at 250% of expectation is hard to sustain. Keep working on generating quality chances so you’re not reliant on miracle finishes. The idea is not to get complacent or discouraged, but to use the numbers as feedback. Remember, even elite players use this kind of feedback: a striker might know they’re getting 0.5 xG worth of chances each game on average and will work to bump that to 0.7 by positioning better.
Set Goals and Targets: Use your ixG data to set specific, achievable targets for the next week or month. For example:
Shot Selection Goal: “I want at least half of my shots next tournament to be from inside the box.” If currently only 2 of your 6 shots per game are inside, aim to improve that ratio. This might mean sometimes choosing not to shoot from 25 yards and instead playing a wall pass to get into the box, or dribbling a bit further in before shooting.
On-Frame Goal: “I want to hit the target on 60% of my shots.” If your chart shows a lot of red X’s (misses), focus on forcing a save every time. This could be a technique issue (keeping your knee over the ball, not leaning back to avoid skying it) which you can practice. Even an on-target shot that doesn’t go in has value, it can lead to rebounds and corners, and it boosts your confidence that you’re challenging the keeper. An off-target shot, meanwhile, is a lost opportunity.
ixG Goal: “Increase my average ixG per game from 0.3 to 0.6 by the end of the season.” This is a big-picture goal that means you’re working to create better chances. Strategies to do this might include improving your movement without the ball (to get into open space closer to goal), studying defenders’ habits to find gaps, or increasing your fitness so you can be more active in the box late in games. You could also achieve it by simply shooting a bit more when in good positions, sometimes players hesitate to shoot even when they have a decent look. If that’s you, be a little more selfish (in a good way) and take that shot when it’s on.
Involve Your Coach (Share Your Insights): Coaches love when players take initiative in their development. If you’re tracking your shots, mention it to your coach and show them what you’ve found. For instance, you could say, “Coach, I noticed in the last few games all my shots have been from outside the box. I think I need to work on finding space closer to goal.” Any good coach will be impressed by that level of reflection, and they can help you. They might run a training drill for you to practice receiving the ball in the penalty area, or they might give you a specific in-game task like “next match, try to get 2 shots from inside the 6-yard box.” Some coaches may even help you refine your ixG values or add factors (like whether it was a header or your weak foot, since those can affect chance quality). This turns your ixG project into a collaborative effort and shows you’re serious about improving.
Maintain a Growth Mindset: The whole point of this ixG exercise is to learn and improve, not to beat yourself up with stats. If the numbers aren’t where you want them to be, that’s okay, it gives you a baseline to work from. Each week, focus on one aspect. Maybe this week you concentrate on shot accuracy (turning some of those red X’s to blue dots by hitting the target). Next week, maybe you work on positioning, trying to sneak into Zone 1 or 3 more often. Small, steady improvements are what we’re after. Keep the tone positive: celebrate when you make progress. For example, if your ixG was 0.2 in a game a month ago and now you got it to 0.8 in a recent game (by getting yourself great chances), that’s a win, even if you didn’t score on all those chances. Over time, the goals will follow because you’re consistently doing the right things. As the saying goes, “Take care of the chances, and the goals will take care of themselves.”
Boosting Confidence and Decision-Making: One wonderful side effect of tracking your ixG is on your confidence. Soccer can be tough on confidence, especially when you’re in a scoring slump. But ixG gives you another way to see success. Maybe you went a few games without scoring, that can feel frustrating. But your ixG chart might show that you’ve actually been getting into great positions and were just a bit unlucky or met a hot goalkeeper. You might say, “Hey, I generated 1.0 xG in that tournament even though I scored zero goals. On another day, I would have had 1 or 2 goals. I’m doing the right things.” That realization can keep you upbeat and motivated to stick with it. Conversely, if you score a goal or two from very low-xG shots (like a free kick goal from 30 yards), enjoy it, but also recognize that “okay, that was a low-percentage shot; I can’t rely on free kicks to bail me out every game. I still need to increase my overall chance creation.” This balanced perspective will improve your decision-making. You’ll know when a shot is on (because you’ve literally studied what constitutes a good shot for you) and when you might be better off passing or repositioning. Over time, you’ll start making those decisions instinctively, and that’s when you really level up as a player.
Finally, remember that ixG is a tool, not a rule . Soccer isn’t played on a spreadsheet, it’s played with your eyes, brain, and heart on the field. There will be moments when you have to trust your gut. Maybe an opportunity looks tough, but you know your own ability or you catch the keeper off guard, go for it! The point of tracking ixG is not to remove creativity or discourage bold plays. It’s to give you a framework so that over the long term, you’re stacking the odds in your favor. As you incorporate this into your routine, you’re training yourself to think like an elite forward: always aware of where the goal is, where the defenders are, and what the percentage of a given shot might be. That awareness will become second nature, helping you choose the right moments to shoot.
Weekly Family “Data Review” Tradition
A practical suggestion: make the ixG review a weekly family tradition. Maybe every Sunday evening, you and your parent sit down for 10 minutes with the shot chart from the weekend’s game. Go through each shot:
“This one was from the top of the box, so about 0.1 ixG, and I pulled it wide. What could I do next time? Maybe take an extra touch inside to improve the angle.”
“That one was a great chance, right in front (0.4 ixG), but the keeper saved it. Perhaps I could try to lift it higher next time, or place it closer to the corner.”
“Here I had an off-balance shot. The chance was only 0.05, and it went off target. Maybe I should have recycled the ball instead of shooting, or tried to beat one more player to get closer.”
This kind of reflection, done in a calm setting after the emotions of the game have settled, is where a lot of learning happens. Encourage your parent to ask questions and let you do the thinking, rather than them telling you what was right or wrong. The goal is for you to recognize “good shot vs. forced shot” in retrospect, so that gradually you’ll recognize it in real-time during matches.
You can even involve siblings or make it fun, perhaps have a chart on the wall tracking your ixG and goals each week, so the whole family gets invested in your progress. Keep it light and encouraging. Maybe set a reward for meeting a goal you set (like if you hit your target of averaging 0.5 ixG per game this month, you all go out for ice cream, etc.). Little incentives can keep it fun.
Conclusion
By creating your own ixG model, you’re taking charge of your development as a goal-scorer. You’re learning to focus on the process (getting good chances and taking smart shots) rather than just the outcome (goals). And by involving your parents, you’re turning what could be sideline stress into a productive, supportive activity. As the founder of Beast Mode Soccer, I’ve seen firsthand how empowering players with knowledge can transform their game. When you understand why a shot is or isn’t likely to go in, you start playing with a higher soccer IQ.
So print out those shot maps, grab a pen, and recruit your parents as your personal data trackers. Every shot you take is an opportunity to learn. Over the season, you’ll literally see your “shot patterns” emerge on paper and in the numbers. Maybe at first your map is all over the place, but as you work at it, you’ll see more and more marks in that prime goal-scoring zone. That’s progress you can be proud of. Keep iterating: track, review, adjust, and go again.
Remember, even the pros continuously refine their shot selection, it’s one big reason players like Rachel Daly and Erling Haaland score buckets of goals . They marry hard work with smart work. You can do the same. Use ixG to work smarter: take better shots, involve your teammates to create quality chances, and become a more efficient finisher.
Now get out there and start your ixG journey. Make it a fun challenge to beat your “expected” goals or to push that number higher with each game by getting into great positions. You’ll not only score more, but you’ll also gain confidence knowing that every shot you take has purpose behind it. Good luck, and enjoy the process of becoming a sharper, smarter striker!
And remember: It’s not about taking more shots, it’s about taking better shots.
If you would like a copy of the ixG pdf I referred to, click here: https://beastmodesoccer.com/ixg-individual-expected-goals-sheets/